
- Introduction
The giant Groningen field was found in 1959. Remaining reserves are about 800 BcM (vs. about 2800 BcM of initial reserves). The field is exploited by NAM (50 % Shell, 50 % ExxonMobil) on behalf of the “Maatschap Groningen”, a partnership of NAM (60 %) and EBN (40 %). EBN is wholly owned by the Dutch state.
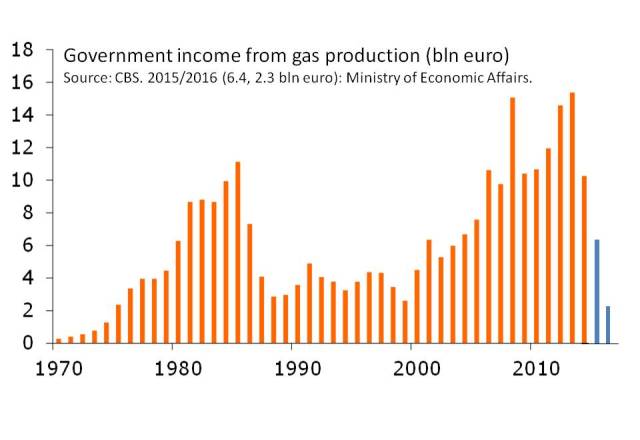
Including the effect of taxes, 85 – 90 % of the profits from the field go to the Dutch state. Income from gas production (which is for about 80 % coming from Groningen) accounted for about 10 % of state income over the 1975 – 2015 period.
Over the years earthquakes related to gas production have increased in number and magnitude. The shallow depth of these earthquakes (as well as the frequent occurrence of a very low velocity layer just below the surface) implies that earthquake intensity and damage to houses are relatively large compared to the seismic magnitude. Older houses and farms built with single brick walls are especially vulnerable. A turning point was the 2012 Huizinge 3.6 magnitude earthquake which damaged thousands of houses. This was followed by the realization that the estimate for the maximum potential magnitude of 3.9 for a Groningen earthquake, assumed so far, was likely to be too low (and subject to considerable uncertainty) and that seismicity could not only result in material damage but potentially also in loss of life.
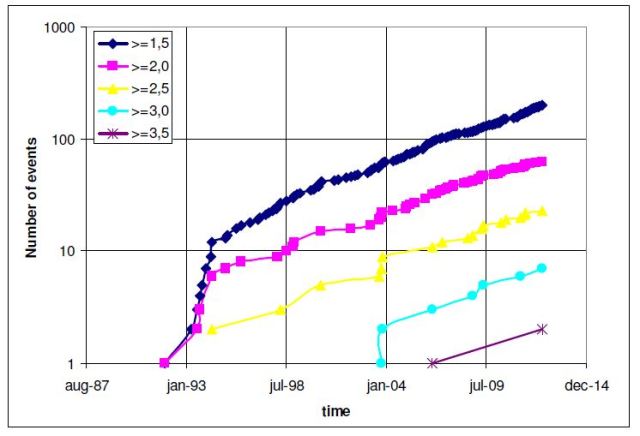 Number of earthquakes exceeding a certain threshold magnitude as a function of time (from Muntendam and de Waal, 2013). It is likely that light tremors already took place during the late 1980’s (the seismometer network has been gradually extended and is only expected to have detected all tremors with a magnitude greater than 1.5 since the mid 1990’s).
As a result the Dutch government has put in place a production cap for the field (as well as separate caps for the area’s most affected by seismicity), leading to a significant decrease in production and government income. By October 1, 2016, the production cap has been lowered to 24 BcM per year (in 2013, the last year prior to the recent production caps, yearly production was still as high as 54 BcM). The double hit from production caps and declining gas prices has resulted in a severe decrease of government income from about 15 bn Euro (2013) to little over 2 bn Euro (2016).
- Groningen earthquakes through time
The first registered earthquake in the Northern Netherlands related to gas production took place near Assen in 1986. The first registered earthquake from the Groningen field occurred in 1991. In 1993 a joint NAM, KNMI (the Dutch meteorological institute – which also has a section monitoring seismicity in the Netherlands) and SODM (the government entity supervising the oil and gas industry) study (in Dutch) confirmed the relation between gas production and earthquakes. Prior to 1986 no earthquakes whatsoever had been recorded in the tectonically quiet Northern Netherlands.
What has not helped the public image of the NAM in the long term is that from 1986 to 1993 they denied a relation between gas production and earthquakes. Instead of admitting that when earthquakes start to appear at producing gas fields (in an area without any recorded seismicity so far) there is very likely to be a relation (be it that the way this works is not well understood) they went into denial mode.
This denial mode continued for many years. The 1993 joint report contained a section in which an estimate was made of the maximum potential magnitude of a Groningen earthquake. This method (using a Gutenberg Richter relation between earthquake magnitude and frequency) played a key role in KNMI reports with estimates of maximum magnitudes for years to come. The problem is that deriving a maximum potential magnitude from historically observed seismicity, using the Gutenberg Richter relation, is something that can only be done for stationary situations (as is usually the case for natural earthquakes). A depleting gas field, however, is not a stationary situation at all. If anything it gave a lower bound for the maximum magnitude of a future Groningen earthquake. For Groningen, as depletion progressed, the KNMI gradually revised its estimates from an initial 3.3 (1993) to an eventual 3.9 (2006), upon which it eventually became increasingly clear that this method was not defendable.
For a long time both NAM and SODM were not proactive in starting further research (for instance to determine uncertainty estimates on KNMI’s estimates or to invite alternative views from other research organizations). The focus of the NAM was very much on subsidence rather than on seismicity. An in depth review is given in a report of the Dutch Safety Board on Groningen earthquake risks. There was a genuine expectation in NAM that earthquakes could only result in limited material damage. This was not backed up by solid research, however, and in hindsight uncertainties were severely underestimated.
- Understanding Groningen earthquakes: differential compaction related to faults
The Groningen gas is contained in Rotliegend sandstone reservoir (in the pores in between the sandstone grains). The gas originates from deeper Carboniferous coals. As these coals experienced increasing pressure and temperature (while gradually being buried deeper over geologic time) they started to expel gas which moved upwards (due to its low density) to the overlying sandstones. The sandstones in turn are overlain by Zechstein salt which is impermeable. As a result gas accumulations exist in those places where the Top of the Rotliegend sandstones is at a relatively shallow depth (i.e. more shallow compared to surrounding areas) so that the gas, which cannot move upward through the salt, cannot escape laterally.
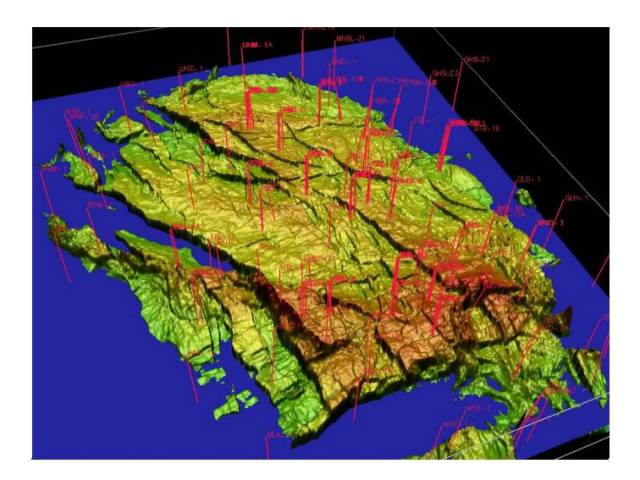 3D view (from the SW) of the Top Rotliegend. Colors denote depth (red is highest); blue plane denotes the Gas Water Contact; red lines denote wells. Source: NAM MMax workshop.
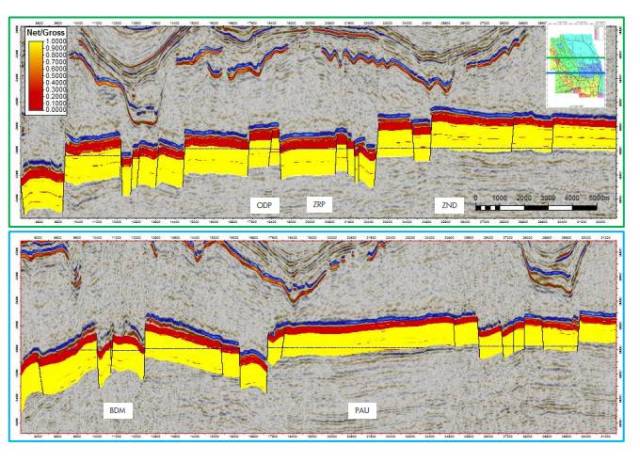 E-W cross sections across the Groningen field, illustrating how faults offset the Rotliegend reservoir layer (in yellow). Red layer denotes the Ten Boer shales above the Rotliegend. Zechstein salt immediately above the Ten Boer; Carboniferous below the Rotliegend sands. Source: NAM MMax workshop.
As gas is being produced, the pressure in the gas decreases and the overburden of about 3 km thickness starts to exert a greater pressure on the sandstone grains. As a result, the sandstone starts to compact. For the Groningen field the total amount of reservoir compaction due to gas production is expected to range up to about 50 cm (for a layer that is up to about 250 m thick). If compaction were to take place homogeneously over the field significant seismicity would be unlikely to arise and the main adverse effect of gas production would be the gentle subsidence bowl that we see developing in the Groningen area since the 1960’s. Unfortunately it does not. The Groningen field is affected by numerous faults and these faults can lead to strong local variations in compaction. As differential compaction over a fault increases, shear stresses on the fault plane build up and at some stage the strength of material at the fault (a zone of weakness) is overcome after which rupture takes place on (part of) the fault plane.
There are a number of ways in which faults can lead to differential compaction. The most straightforward one is that faults offset the gas bearing reservoir vertically. As a result compaction at a given depth varies laterally (shown schematically in the figure below).
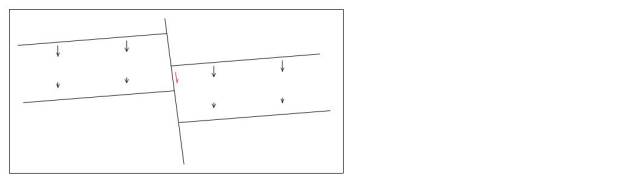 Schematic representation on how earthquakes can be triggered in a compacting, faulted reservoir. The actual situation for Groningen is much more complicated. The thickness of the Rotliegend reservoir sands varies considerably over the field (from about 80 to 250 m) and over the field area some 1600 faults have been mapped (a few large ones and many small ones).
In addition faults can be baffles (if not hard boundaries) to flow. As a result pressure differences across faults may arise which can result in differential compaction and seismicity. Reservoir simulation models of the Groningen field point to some faults that are indeed sealing. Regionally, the NW-SE trending strike slip faults are often observed to be sealing faults. Until recently NAM’s production philosophy has been to minimize pressure differences across the field (helped by the excellent permeability of the Rotliegend reservoir). As a result it seems unlikely that pressure differences between major compartments make a large contribution to differential compaction and Groningen seismicity.
Finally, faults should not be seen as sharp boundaries. A larger fault tends to be surrounded by many smaller ones as well as a zone (“damage zone“) where reservoir quality is impaired and porosities are substantially reduced. For faults in similar, smaller Rotliegend fields in the Dutch offshore such damage zones are observed to be about 50-100 m wide, with an average porosity reduction of about 3 p.u. (ranging up to about 5 p.u.). With compaction being strongly, non-linearly, dependent on porosity such a reduction in porosity can easily result in a reduction of compaction by roughly a factor 2. Damage zones may be the most pronounced for strike slip zones which have experienced major displacements (but do not necessarily stand out on seismic as their vertical displacement may be limited).
- Key observations on Groningen seismicity
Significant progress on our understanding of Groningen earthquakes has been made over the last few years. The network of seismometers has been extended and now includes seismometers at depth, reducing the uncertainty of earthquake locations. We can now be more confident that earthquakes are taking place at (or in the immediate vicinity of) the Rotliegend reservoir. Two key empirical observations are listed below.
Seismicity (initially) increases with total reservoir compaction. A threshold exists of about 10 – 15 cm of reservoir compaction before the onset of seismicity. Beyond this threshold seismicity starts to increase in both number and magnitude.
Apparently this is the amount of compaction needed to bring shear stresses on faults (or at least on some locations, on some faults) to the critical level required for rupture. Initially, stresses on faults (at least at Rotliegend level; likely also at e.g. deeper Carboniferous levels) are not anywhere near the level required for rupture. This is in accordance with the complete absence of natural earthquakes in the Northern Netherlands.
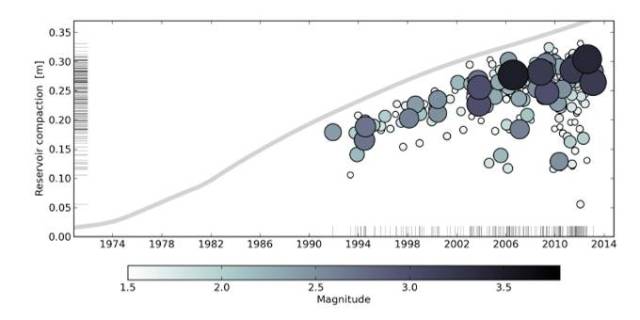 Time series of M > 1.5 earthquake magnitudes versus reservoir compaction at the origin time and epicentre of each event (from Bourne and Oates, 2014).
What is less clear is how (if at all) this trend will continue in the future. As long as most earthquakes are related to the first slip event on a fault (segment) seismicity is indeed expected to continue to increase with the total amount of compaction. But once most earthquakes become related to a second or later slip event on a fault (segment) the increase of seismicity with compaction will start to diminish and we may even start to approach a stationary situation.
The figure below shows the fraction of energy related to compaction that has been released seismically (“partitioning fraction”) as a function of the total amount of compaction. Although far from being conclusive (the highest amount of compaction has been reached in a relatively small area only) it cannot be excluded that the partitioning factor is levelling off at a total compaction greater than 20-25 cm. The absence of earthquakes during the first 20 years of production turned out to be no guarantee that earthquakes would remain absent over the entire field life. In the same way, the increasing intensity of seismicity as observed over the 1991-2012 period is no guarantee for its continued increase in future. Our predictions on future seismicity are to a disappointing extent still based on statistics and extrapolation of known trends (rather than a complete understanding and geomechanical modelling of the actual physical processes).
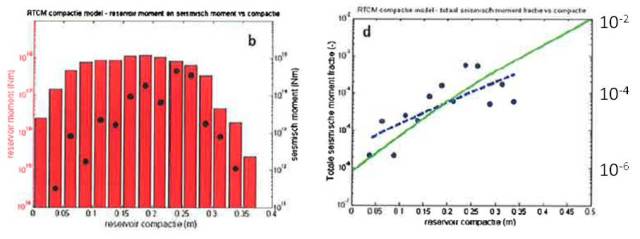 Partitioning fraction (seismic moment divided by total reservoir compaction moment) for different compaction classes. Green line (NAM) and dashed blue line (TNO) denote relations between the partitioning fraction and reservoir compaction for different models. Note the large amount of uncertainty for the future partitioning fraction in the forthcoming late stage of the Groningen field life. Source: TNO report R11953 (December 2013, in Dutch). It is quite conceivable that the partitioning fraction continues to increase (at a similar rate as observed so far). It is also quite conceivable that the partitioning fraction is levelling off at a value of about 10-4.
Seismicity increases with fault intensity. Within the area of high compaction at reservoir level, seismicity is the most pronounced in areas with a high intensity of faulting. The intersection of numerous NW-SE trending faults with the high compaction area near Loppersum experiences the highest seismic intensity. In comparison, an area with a similar high amount of compaction and a low fault intensity further towards the N experiences a much lower level of seismicity. There is no obvious relation between seismicity and fault throw.
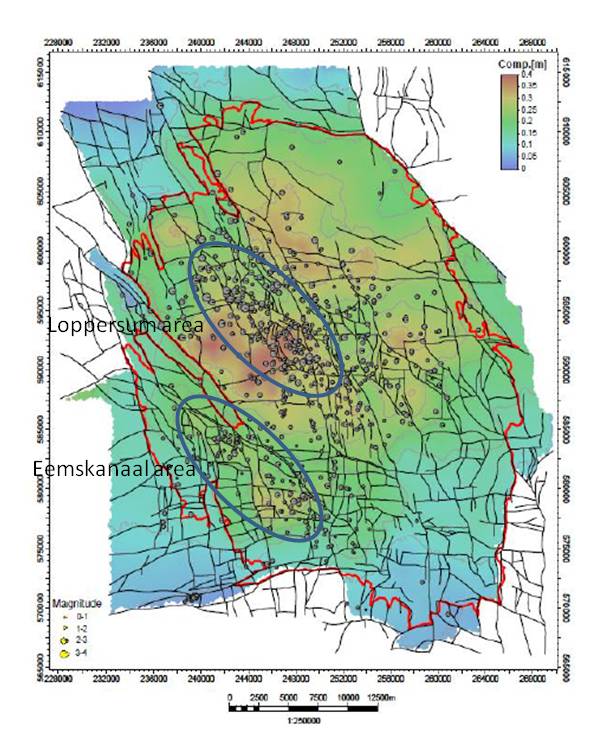 Compaction (denoted by color; color scale ranging from 0 to 0.4 m). Black lines denote faults from the NAM static model. Red line denotes outline of the field. Seismicity is denoted by symbols (size of the symbol indicates event magnitude). Location uncertainty of seismic events is about 1 km. Highest seismic activity takes place in a region of high compaction and high fault intensity. Source: TNO report R10755 (based on the NAM 2013 static model).
These observations (and in particular the observation that there is no clear correlation between fault throw and seismicity) indicate that fault damage zones may play an important role in Groningen seismicity. The Groningen field is intersected by zones of anastomosing faults, indicative of strike slip faulting (in particular in the Loppersum area and in the Eemskanaal area). Elongated damage zones in these areas (with a much lower amount of compaction) can account for the observation that seismicity is distributed over a larger area (rather than being concentrated on the few large throw boundary faults) and is associated with faults that often do not have a large vertical displacement.
Wells in these areas do sometimes intersect such a damage zone (the clearest example being the EMK-2 well). When incorporated in a static model such wells may erroneously influence the reservoir properties in the model over a large area (resulting in a pronounced mismatch between modelled and observed subsidence).
The observation that there is no clear correlation between fault throw and seismicity critically depends on the correctness of KNMI’s estimate of earthquake location uncertainty of about 1 km. If this uncertainty is severely under estimated it could be that events in reality do primarily take place on the large throw faults. Future work, based on the recently extended network of seismometers, should enable us to better delineate Groningen earthquake locations.
- Time dependent processes such as creep play an important role.
There is a clear correlation between production and seismicity on a seasonal basis. There is a certain time lag (of about 3 – 6 months) in between, however, and time dependent processes such as creep play an important role.
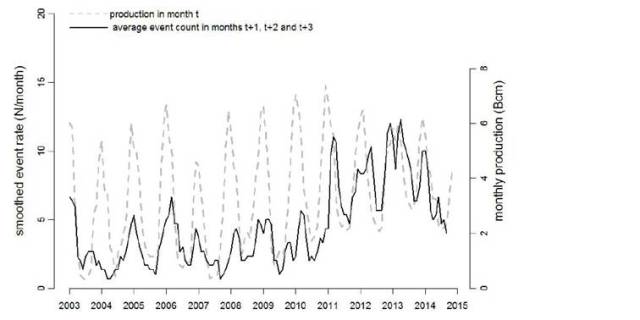 Monthly Groningen gas production (gray dashed line) and smoothed earthquake event rates (black solid line). Event rates clearly correlate, with some time-delay, with the seasonal pattern in production rates. From Bierman et al., 2015.
Already during the early phases of production it was recognized that subsidence initially took place at a much lower rate than expected (based on laboratory compaction experiments). This effect was only properly understood upon Hans de Waal’s work at Shell’s research lab (and following thesis at Delft University) on rate dependent compaction of sandstone reservoirs. To date, this work is still the basis for most of the Groningen subsidence models.
As a result of time dependent deformation of the Rotliegend it is not clear to what extent production measures will result in an additional reduction of seismicity. In other words: will a reduction in production rate by a factor 2 result in an end member reduction of seismicity by a factor 2 only, per fixed time interval, or (and to what extent) will there be an additional reduction as creep reduces the partitioning factor?
- Uncertainties are there to stay
In spite of all the advances in recent years, both regarding observations and modeling, our understanding of earthquakes related to gas production – and in particular our ability to predict future earthquake intensity – remains limited.
Maximum potential seismic magnitude. A workshop on the maximum potential magnitude of Groningen earthquakes was held in March 2016. The outcome from this workshop is a range that is larger than ever before; spanning from 3.8 to 7.25. Not all values within this range are equally probable though and the key question is whether fault rupture will be (mostly or completely) contained within the Rotliegend reservoir or whether rupture can take place over much larger surfaces in the underlying Carboniferous (whether tectonic or triggered by Rotliegend earthquakes).
Should earthquakes remain (largely) confined to the Rotliegend (which is likely – but exact how likely is something for which estimates differ) then the range for the maximum potential magnitude is estimated to be about 3.8 – 5.0. The dimensions of the Groningen field, the thickness of the Rotliegend and the maximum expected pressure drop imply that in this case a Groningen earthquake is unlikely to exceed a magnitude of 5.0.
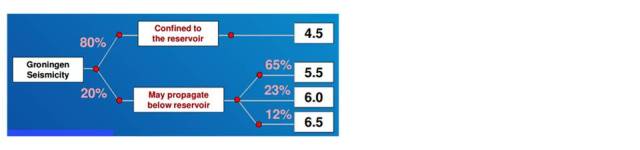 Example of a logic tree for the maximum potential magnitude of a Groningen earthquake, as presented at the MMax workshop (from the ExxonMobil contribution). For different contributions the exact ranges and probabilities may differ. The final range of 3.8 – 7.25 represents the full range of all individual contributions. Personally I would put in a much lower probability for Groningen earthquakes to propagate significantly into the Carboniferous.
Effect of recent production measures. The production caps that have been put in place contain 2 different elements: an overall production cap and specific production caps for the Loppersum and Eemskanaal areas.
For the overall production cap the key question is whether such a production rate decrease will merely result in the same amount of seismic energy now being released over a longer period (which is what the models in the NAM winningsplan tend to predict) or will also result in a reduction of the total amount of seismic energy to be released (which is what is suggested in the SODM reaction to the NAM winningsplan).
For an area production cap such as the one for the Loppersum area the key question is whether this only buys this area a temporary reprieve (and seismicity resumes once that the pressure decline resumes – something that will happen within about a year given the good overall connectivity in the area) or whether a more gradual pressure decline in the Loppersum area will result in a long term reduction of seismicity as well.
TNO expects that for a more gradual pressure drop (primarily due to a smaller seasonal variation in production; for the Loppersum area also due to production taking place at a larger distance) seismicity will be reduced. As yet this is an expectation – which may or may not be confirmed by observations.
- How to deal with Groningen earthquakes?
Regardless of the eventual outcome I would argue that the uncertainties mentioned above can be managed:
– seismic intensity and maximum observed magnitudes have been observed to increase gradually. Although it cannot be completely excluded an event with a magnitude much greater than what has so far been observed (e.g. including a significant slip component in the Carboniferous) seems quite unlikely.
– production measures work. Local production caps in a high risk region have a marked effect on seismicity within months.
This should enable us to manage production with a hand on the tap like strategy (like for the Waddenzee production) in a responsible way. Currently, the risk of a fatality is estimated to be very small (<< 1). Should risk levels stay roughly at this level the number of fatalities over the coming 30 years would be expected to be of an order of magnitude of 1. For comparison: the number of traffic deaths in Groningen over the coming 30 years is expected to be of an order of magnitude of 1000. Large uncertainties exist for these estimates. But at least we have a calibration point: the last 5 years (with a risk likely to have been greater than the risk over the coming years) did not result in any injuries or fatalities.
- Alternatives are more costly, less environmentally friendly
A study by CE Delft (an engineering consultancy) looked into the consequences of a number of alternatives for Groningen gas for the environment and for Dutch state income. Alternative sources considered were Russian gas (capacity wise much more feasible than Norwegian gas), LNG (from Qatar) and gas from yet to be developed small Dutch offshore fields. In addition the effects of a reduction in gas consumption were studied.
These alternatives imply a substantial loss of income to the Dutch state. In addition, with the exception of a reduction in gas consumption, they are also less environmentally friendly.
Russian gas, for instance, implies both additional CO2 emissions (roughly 12 % of the gas is needed to transport gas from Russia to The Netherlands due to the low efficiency of the Russian gas transport system) and additional methane emissions (methane losses related to transport over large distances in Russia are expected to be significantly higher than methane losses related to transport over short distances in The Netherlands). Effective emissions (CO2 equivalent) are estimated to be about 25 % higher compared to Groningen gas.
From an environmental point of view a reduction in gas consumption is by far the preferred option. It is not going to happen in the short term, unfortunately. Groningen gas production has already been cut by approximately 50 %; the energy transition will take decades.
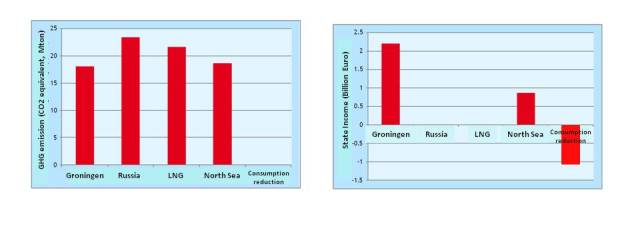 Consequences for emissions and Dutch state income of a reduction of Groningen gas production by 10 BcM per year. Alternatives for Groningen gas considered are Russian gas, LNG (Qatar) and new Dutch offshore gas fields (questionable whether they can have a substantial impact – given the limited exploration successes in recent years in the very mature Southern North Sea). In addition the effects of a similar reduction in gas consumption are studied.
Another option is to reduce seismicity by maintaining reservoir pressures at a higher level. The most straightforward method to reduce the reservoir pressure drop is by nitrogen injection. This has been studied extensively by NAM in recent years and has been rejected as:
- This is very high cost
- Involves a large scale industrial project that will take at least until the mid 2020’s before first injection
- Involves major CO2 emissions and industrial activities throughout the region
- Will result in a reduction of gas recovery, with some hydrocarbon gas being bypassed by nitrogen.
- May well result in adverse effects; large scale injection may also lead to seismicity and it cannot be excluded that no net reduction of seismicity is reached.
- The number of damage claims is rapidly increasing due to people putting in claims for damage unrelated to earthquakes.
Over the past few years the number of damage claims has rapidly increased to over 500 claims per week on average. This increase is not related to an increase of seismicity. On the contrary, the total seismic energy released (per year) peaked in 2012 and has substantially decreased in the following years (see figure below). The largest earthquake in 2012 was the 3.6 magnitude Huizinge earthquake; the largest 2015 earthquake was a much smaller 3.1 magnitude event near Hellum.
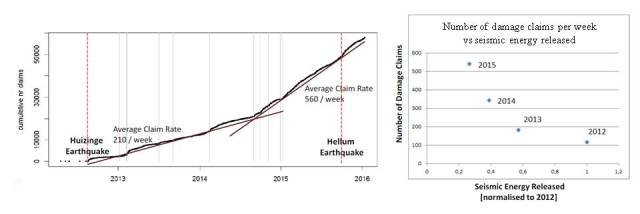 a) Cumulative number of claims as a function of time. b) Average number of claims per week as a function of seismic energy released (both per year) for the 2012 – 2015 period. From the 2016 Technical Addendum to the Groningen Winningsplan.
It can thus be inferred that either a lot of actual damage in 2012 did not result in a damage claim or that a lot of 2015 claims were not related to damage caused by earthquakes. Additional data indicate that the latter explanation is by far the most likely. The figure below shows the percentage of buildings with claims plotted against PGA (Peak Ground Acceleration) for the 2012 Huizinge and 2015 Hellum events. It is expected that houses close to the epicenter and subjected to higher PGA’s have a higher chance of being damaged. For the Huizinge earthquake there is indeed a strong correlation between PGA (which in turn has a strong relation to distance to epicenter) and the percentage of buildings with damage claims. For the Hellum earthquake on the other hand no such correlation is observed and the vast majority of claims come from areas at a large distance from the epicenter with minimal PGA.
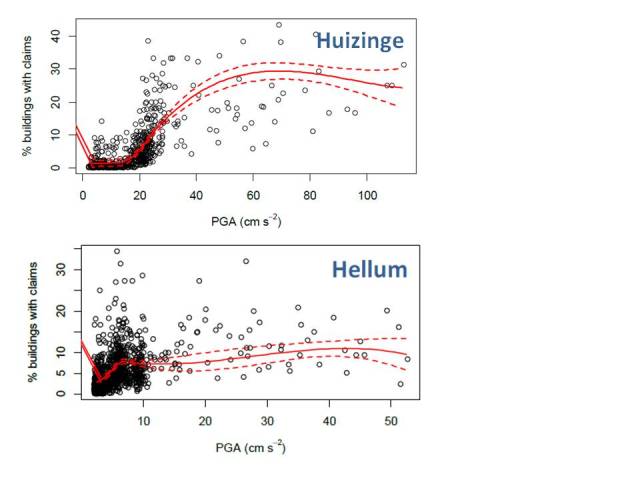 Percentage of buildings with claims plotted against PGA (Peak Ground Acceleration) for the 2012 Huizinge and 2015 Hellum events. From the 2016 Technical Addendum to the Groningen Winningsplan.
In simple words: in 2012 people put in a claim when a crack in their house appeared after an earthquake that had been felt in the area. The large increase in claims in the following years is a reflection of the intense publicity, the ease with which claims can now be submitted and the calls from NGO’s and politicians to put in claims rather than an increase in actual earthquake related damage. That situation is now becoming difficult to manage. The cumulative number of claims of over 60,000 implies a huge effort, at a significant cost to society (the cost of evaluating claims by now outweighs the cost of strengthening houses and compensating damages). The rapidly increasing share of rejected claims add to the disappointment and disillusionment that many people in the area already experience.
- The Dutch government now needs to rise to the occasion. 1) Make choices on the basis of a cost benefit analysis. 2) Accept that a situation that all the benefits are for the country, all the downsides are for the local gas producing region is not fair
To govern is to make choices. The Dutch government should have the courage to compare the risk that people in the Groningen area are running due to earthquakes with the risks that other people in The Netherlands are running. Flooding is a risk that many people in The Netherlands are subjected to. Risk levels for flooding are of similar magnitude as those for Groningen earthquakes. And yet we make a conscious decision not to raise our dikes to a level that gives absolute security. The reason is simple: cost. Not every medical treatment that is possible is being given – even it would extend or save lives. Again the reason is simple: cost. However difficult to accept this may be: with the limited means that we have there is simply no other choice.
I would argue that decisions on Groningen production caps need to be made on the basis of a cost benefit analysis – as is common practice for other (industrial) activities that involve risk. The cost for the Dutch state of billions of euro’s (even if the gas not produced now would eventually be produced in 20 or 30 years from now) by now seems to become disproportional to the risk to human life that these earthquakes pose (for comparison: a single investment of 120 million euro in Groningen provincial roads would be expected to save approximately 5 lives on a yearly basis). The Dutch Council for Security rightly condemned that safety did not play a role in decision making on Groningen production until only a few years ago. But by now there is a risk that we are going to the other end of the spectrum: that safety with respect to Groningen earthquakes needs to be achieved at all cost.
I would argue that the current unrest in Groningen is not just related to earthquakes but also to a long standing feeling that they are being badly treated by the central government. And here they have a point. Peripheral areas in The Netherlands, such as Groningen, tend to be under-represented in the Dutch parliament. When investments from FES, the Dutch infrastructure fund which received 40 % of Groningen gas income for the 1995-2009 period were analyzed it was found that close to 90 % went to the Randstad area (Amsterdam – The Hague – Rotterdam); only about 1 % of the investments went to the three Northern provinces combined.
In general there are good reasons why the proceeds from mineral wealth should go to a country as a whole. But for this specific case, where a single field accounts for close to 10 % of state income for a period of 40 years and where the downside to the local population is long standing and substantial, this just does not seem fair to me. It seems justified to use a part of the Groningen revenue to establish a fund that solely supports the Groningen local economy and infrastructure.

Hi Jilles,
Very well written, argued and clear story. Thanks.
Indeed the challenge will be how to best manage risks and benefits.
LikeLike
Pingback: Hyping the Warm – Ken's Blog
Amazingly written!
LikeLike